
April 17, 2023
Real Estate News in Brief
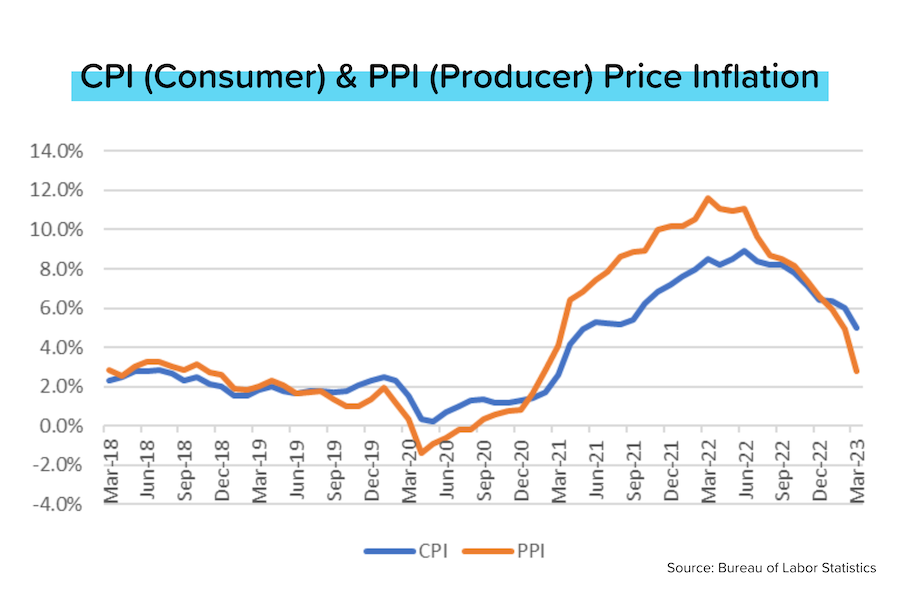
Big decreases in consumer (CPI) and producer (PPI) inflation in March were encouraging signs that inflation (and mortgage rates) should keep moving lower. At the national level, underlying home demand remains very strong and reasonably-priced homes are selling quickly because supply remains tight.
Great news: The “headline” CPI (Consumer Price Index = inflation) figure for March rose just 0.1% MoM. That allowed the annualized figure to drop from 6.0% in February to 5.0% in March. That’s a big move lower in just one month!
Not-so-great news: The “core” CPI (ex-food and fuel) figure for March rose 0.4% MoM, and the annualized figure rose from 5.5% in February to 5.6% in March.
Encouraging signs: According to the BLS, shelter costs (+8.2% YoY) were “the dominant factor” in keeping “core” CPI high. But the increase in shelter costs was just 0.557% MoM in March, the smallest increase since April 2022! Things should get better from here.
In addition, the “headline” PPI (Producer Price Index = inflation seen by businesses) actually REDUCED 0.5% MoM in March. That meant that the annualized PPI dropped from 4.9% in February to just 2.7% in March. If companies choose to pass on these lower costs to consumers, it will help send CPI lower.
MBS Highway’s Housing Survey for April 2023 showed another solid increase in buying activity as the spring selling/buying seasons kicked into high gear. This is the 4th-straight month of improving sentiment, and pricing pressure appears to be at a crossover point.
According to Black Knight, the dollar volume of mortgage rate locks was up 43% MoM in March, as “incredibly rate-sensitive” buyers responded to the sharp drop in mortgage rates (from just over 7% at the beginning of March to near 6% at the end).
Fannie Mae’s Home Purchase Sentiment Index rose 3.3 points to 61.3, but that’s not far above its all-time low set in 2022. 79% of respondents thought it was a “bad time to buy” — mainly due to higher mortgage rates.
More on Shelter and CPI
We’ve been writing a lot about the impact rising shelter costs (rents + owner’s equivalent rents) have had on the overall CPI figure. As a reminder: around 35–38% of “headline” and 43% of “core” CPI comes from shelter costs, and there is a massive (4–5 quarter) lag between market rents (the direction rents are trending now) and the average rent figures that go into CPI. It’s too early to be certain, but it looks as if the growth in shelter costs may finally be peaking. Were it to begin falling, the downward trend in overall CPI would accelerate.
What’s PPI?
The inflation ‘alphabet soup’ can be confusing: CPI, PCE and PPI. You can group CPI and PCE together — they both measure the price inflation experienced by consumers. But PPI is different: it measures the inflation experienced by companies — as they buy the materials required (natural gas, aluminum, chemicals, cardboard etc.) to produce their finished goods. That’s why PPI is sometimes called “wholesale” or “factory gate” inflation.
When PPI (production costs) is rising, companies have a choice: 1) raise their retail prices to keep margins stable, or 2) keep retail prices flat and sacrifice margins (perhaps in order to protect sales volumes). Note: it isn’t binary; companies could pass on half of the cost increases if they wanted to.
When PPI is falling (like now), companies also have a choice: 1) pass on the cost savings to consumers by lowering their retail prices, or 2) keep retail prices stable and enjoy fatter margins.
You can see how PPI (producer prices) and CPI (consumer prices) are related. PPI and CPI move in the same direction, but PPI tends to lead CPI by 1–2 months. That’s why we’re so excited about this month-over-month decline in PPI. Assuming that companies pass on the cost savings to consumers, it should help to dampen (lower) CPI. And lower inflation is great for bond prices, and higher mortgage bond prices usually leads to lower mortgage rates.
MBS Housing Survey for April
Our April survey of loan officers and real estate agents showed another big jump in buyer activity levels and sentiment. This marks the 4th-straight month of improvement.
- 68% of respondents characterized their local buyer activity as ‘Very Active”, ‘Somewhat Active’, or ‘Steady’. That same figure was 56% in March 2023, and just 19% in November 2022.
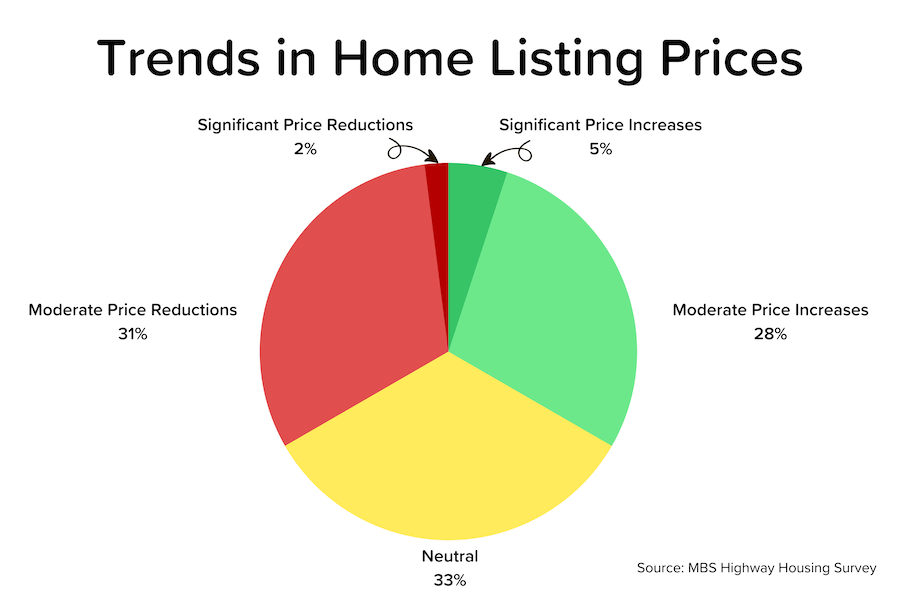
- Pricing pressure appears to be nearing a crossover point. The percentage of respondents experiencing ‘Moderate’ or ‘Significant’ listing price INCREASES has been rising for several months, and hit 33% in March. That’s about the same percentage that are experiencing price decreases in March. [See chart below.]
- While inventory levels rebounded in 2022, the number of available homes for sale remains significantly below pre-pandemic levels. This inventory shortage, combined with the recovery in demand, is spurring a resurgence of buyer competition. 43% of respondents said that homes were ‘Selling Quickly with Multiple Offers’, up from 32% in March 2023 and 20% in February 2023.
- Buyer activity levels and upward pricing pressure were strongest in the Mid-Atlantic, Northeast and Midwest regions. Price reductions were most prevalent (but decreasing) in the Southwest and Southeast, but even there the majority of respondents characterized these as ‘Moderate’ only. The Northwest and West regions, meanwhile, have seen a dramatic reduction in pricing pressure in the last two months.
Mortgage Market
In light of the encouraging inflation data, it would be reasonable to expect that mortgage rates fell during the week — but they didn’t. That’s most likely because:
- Mortgage rates had decreased nearly 50 bps the week earlier
- “Core” CPI was flattish on an annualized basis (vs. the big drop in “headline”) and the Fed cares more about “core”
- The bond market generally pays less attention to PPI, and
- Various Fed members were in the news talking tough on inflation.
The next Federal Open Market Committee (FOMC or “The Fed”) meeting will be on May 3. Will the Fed hike rates +25 bps again, or will it pause? At the moment, pricing for the 30-day Fed Funds futures suggests the answer is 66% (hike)/34% (pause).